Choosing a place to live using Python
Somewhere in April, me and my fiancée began to look for a place to settle down and build our home. Both of us were growing up in rural Poland, and we have learned the value of nature and spaciousness of countryside in our teenage years, so it’s clear that after spending 5 years in rented apartments in Wrocław, we are now convinced the city is no place for us (ongoing pandemic contributed to the decision, too).
Given this context, our preferences for a perfect place are as follows:
- <30 minutes one-way drive to Wrocław, where we both work
- it should be nearby our families and friends (most of them live north of Wrocław)
- closeness to forest, bonus points for stunning view on the forest or hills :)
- for working from home purposes, any good-quality broadband connection (using LTE as home internet, as it’s usual in rural Poland in the absence of cable broadband isn’t acceptable)
- bonus points for alternative way (other than by-car) to reach the city, i.e. public transit
- bonus points for closeness of elementary school, as we plan having children in near future
- as cheap as possible
After a quick glance at the map and estate market, I realized there’s simply too much info for me to process and make the informed decision: in the area of our broad interest, there’s well over 300 villages, and as I calculated later over scraped data, there’s over 1,500 active offers scattered across 3 largest estate offer providers. Adding the fact that those providers let sellers to “refresh” their offer to look like it’s added today on top of the daily offers, it was impossible for me to tell which offer is actually new and worth interesting.
So I decided to gather the data and throw some markers on the map to see the options more clearly. Fast-forward three months of scraping gathering the data and 900 lines of code later, I can honestly say it was worth it.
To give you an idea of process of building my data-map, I’d start with listing worthy data sources:
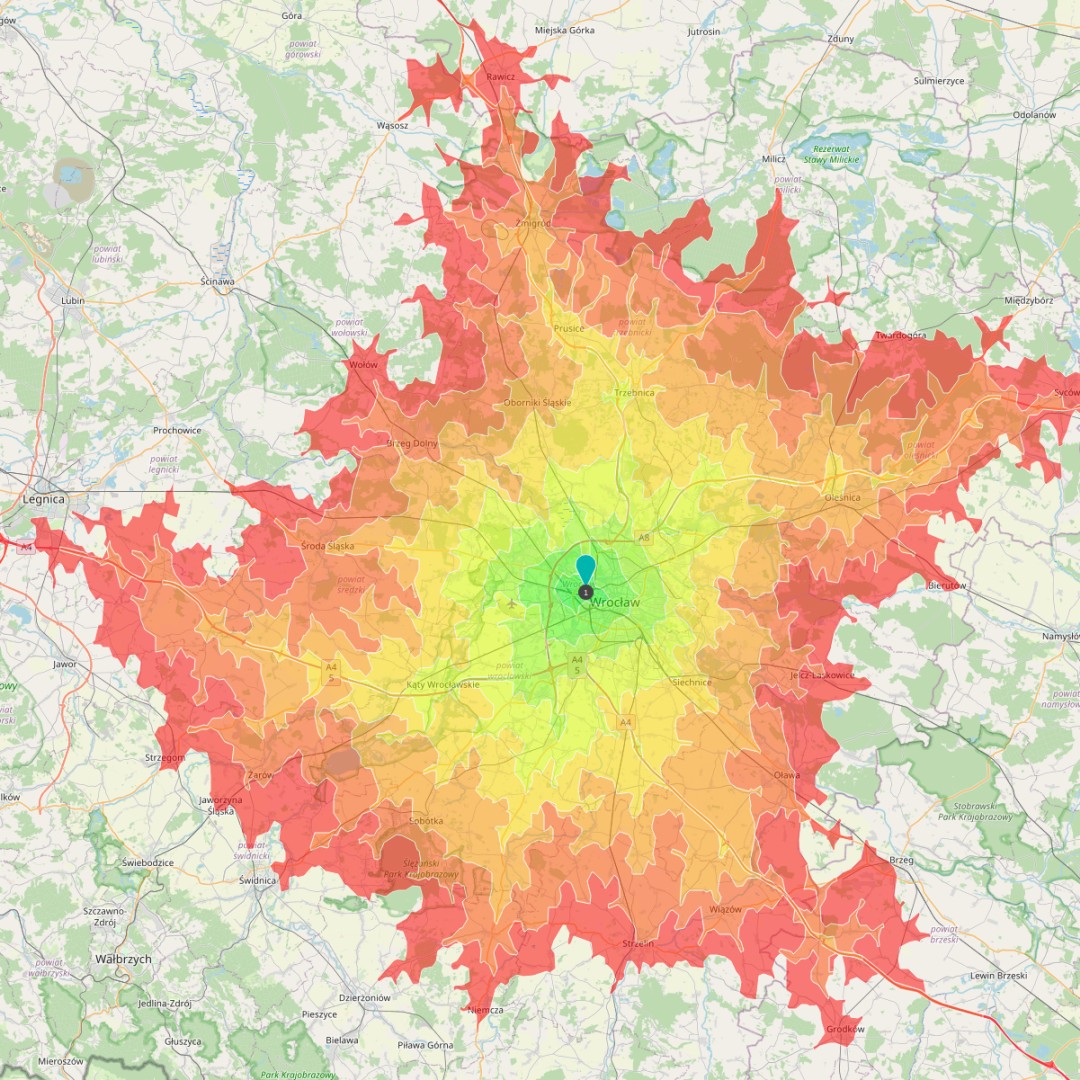
“<30 minutes one-way drive to Wrocław, where we both work”
This requirement was the most difficult for me until I discovered openrouteservice.org, where it’s easy to create a GeoJSON-exportable isochrone map displaying time to reach a destination by car, which in my case was a large shopping mall in Wrocław.
“for working from home purposes, any good-quality broadband connection”
Since 2014, there’s an ongoing effort carried by Polish Ministry of Digital Affairs (with funding from European Union, of course) to build a fiber-optics-based network in small villages across Poland, which for me is a game changer in terms of quality of life in Polish countryside. On the Ministry website, there is a service for rendering (and exporting) data on availability of ISP services across country, which I used to export the data into CSV and use Python to turn it into GeoJSON format.
“as cheap as possible”
To gather pricing information so it’s easy to see how pricing changes across the villages, I ran a daily scraper using popular CI service for three main estate offer listings since April, outputting most valuable data into CSV files. Then those files would get inserted into SQLite DB, and with some SQL queries, I got average price per square meter in each village or town and truly recent offers. Then it was just a matter of rendering the data into some inter-operable format, like GeoJSON.
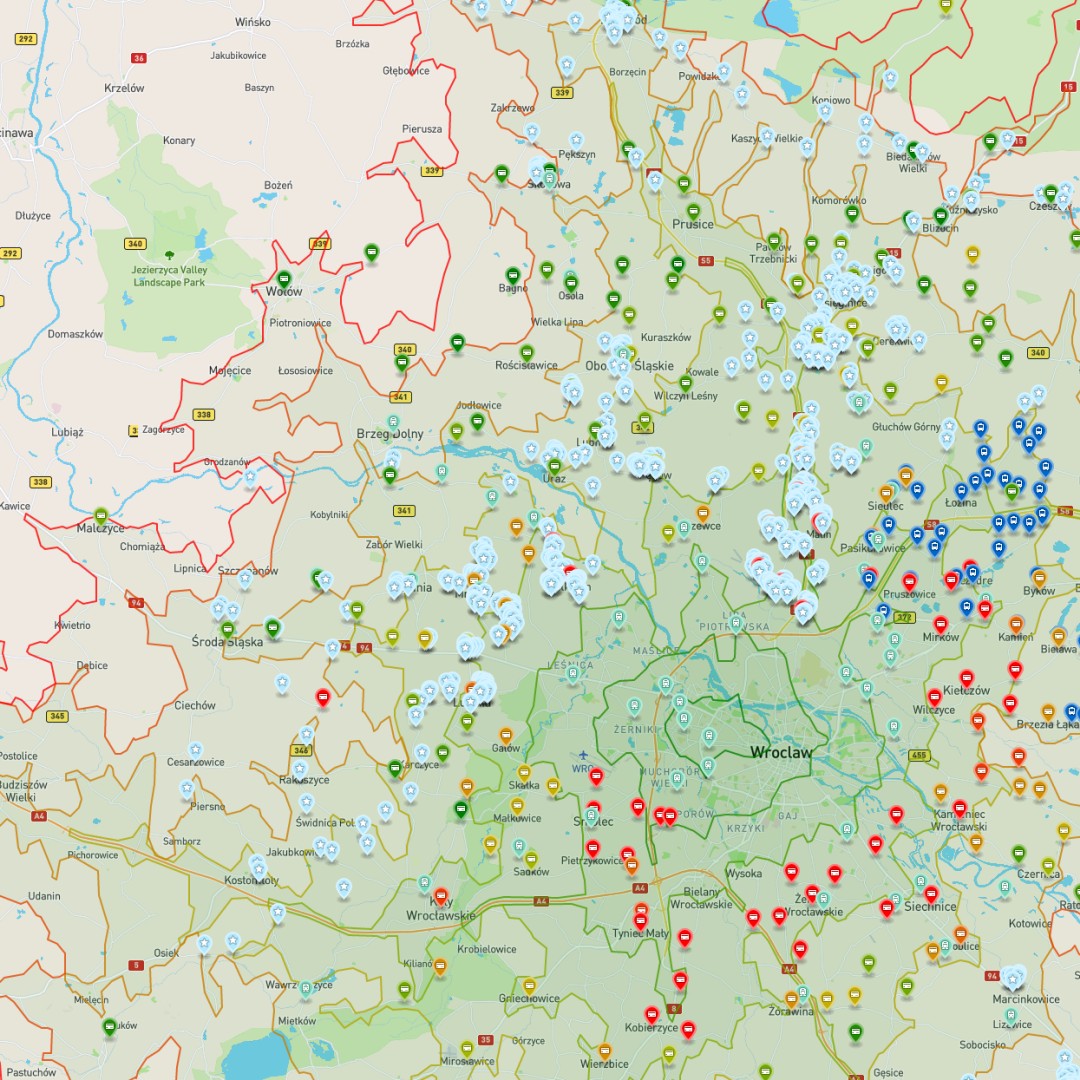
To make data visual and put it on the map without writing JavaScript code (which I’m not fond of), I decided to use geojson.io as WebUI. The site lets you render any arbitrary GeoJSON file directly onto Mapbox, and since it supports storing and loading the data as Gists, it was a no-brainer: the final artifact is easy to export as Gist anyway.
You can see the end results here (it takes a few seconds to load).
The code for all these transformations (but without the scraping part) is available on my GitHub.